Index Structure
The Pesticide Risk Tool (pesticiderisk.org) is designed as a probabilistic risk ranking tool rather than an absolute measure of environmental harm. It is strongest in its ability to compare pesticide options relative to each other and to evaluate the impact of changing application rates and methods, and using alternative, lesser risk products. For some of the indices (see descriptions below), field results have been used in order to calibrate the risk scores against actual ecological damage.
Reading the Risk Outputs
Image one (below) shows a risk summary for two products grouped by risk index for the Environmental Indices risk chart.
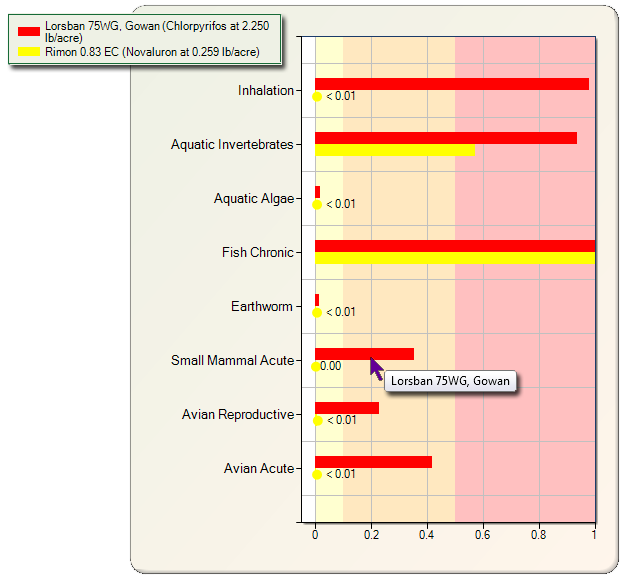
Image 1 (risk scores grouped by index)
The risk indices are shown on the y-axis, while the risk index scores are shown on the x-axis. The bars indicate the risk scores for each pesticide application in each index. The legend in the left hand corner shows which color represents which application. Also, by hovering your mouse over a bar, you can display which product the bar represents.
Image two (below) shows a risk summary for the same two products but this time grouped by product.
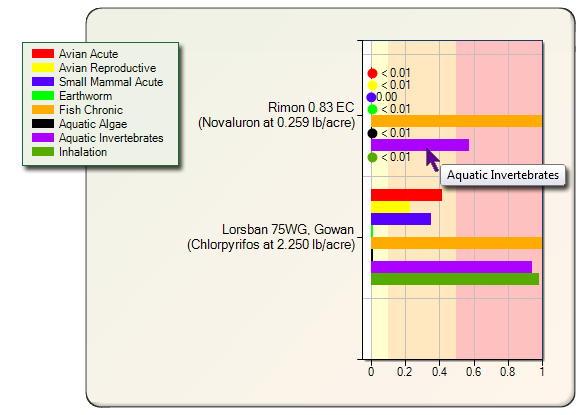
Image 2 (risk scores grouped by product)
The products are shown on the y-axis, and the risk index scores are shown on the x-axis. The bars indicate the risk scores for each index. The legend in the left hand corner shows which color represents which risk index.
Environmental Risk Indices
The Pesticide Risk Tool calculates potential risks of pesticide applications to the natural environment (except for pollinators, which are considered separately) in the form of seven Environmental Risk Indices. The seven indices cover a broad range of organisms potentially affected by pesticide applications. The risk index scores for the environmental indices range from zero to one and are probability scores:
- For acute risk indices: the risk score represents the probability of a stated impact as a result of the pesticide application. For example, the undesirable effect for the Avian Acute index is mortality – the killing of birds in and around a crop field; a score of 0.1 means that there is an estimated 10% chance that the pesticide application will kill birds; a score of 0.5 means a 50% chance.
- For chronic risk indices the risk score represents the proportion of the breeding season where reproduction is inhibited. For example, for the Fish Chronic index, the highest possible risk score of 1.0 means that a pesticide application is estimated to inhibit reproduction in a sensitive fish species in waters draining the field for the entire breeding season.
Acute Indices
Avian Acute
- Undesirable effect: Increased bird mortality due to a pesticide application. This would be detected through a thorough search of the treated field and surrounding area.
- Index score: The probability that a given application will give rise to visible bird mortality. This probability has been calibrated against actual field studies carried out with a variety of pesticides and thorough carcass searches. For example, a score of 0.20 indicates that, given the existing body of avian field studies, we would expect to find avian mortality in approximately 1 out of every 5 (20%) applications.
Small Mammals
- Undesirable effect: Increased small mammal mortality rate sufficient to cause a population decline due to a pesticide application. This would be detected through a population study, such as a mark-recapture study, in the treated field and surrounding area.
- Index score: The probability that residues will persist long enough at a toxic level to cause changes in the population of small mammals directly exposed to the spray. This probability has been calibrated against actual mark-recapture field studies carried out with a variety of pesticides.
Earthworms
- Undesirable effect: Loss of at least 35% of earthworm biomass.
- Index score: The probability that substantial earthworm mortality (i.e., > 35% loss of a species of average sensitivity) will result from the pesticide application. This probability has been calibrated against actual field studies carried out with a variety of pesticides.
Aquatic Invertebrates
- Undesirable effect: More than 10-20% of invertebrate taxa are significantly impacted by the pesticide application, their numbers being reduced often by 10 fold; sometimes 1000 fold.
- Index score: The probability that 10-20% of invertebrate taxa in waters draining the treated field will be ‘significantly’ affected. This probability has been calibrated against actual field studies carried out with a variety of pesticides applied at known concentrations as well as modeled estimates of exposure. For such studies to show statistically ‘significant’ effects, reductions in the number of individuals in affected taxa often have to be more than 10 fold because of the natural high variation that exists in these systems. The aquatic invertebrates scores also have been shown to be protective of acute effects on fish.
Aquatic Algae
- Undesirable effect: More than 20-30% of algal taxa are significantly impacted by treatment, leading to their growth being impeded so that their overall abundance or biomass is reduced by 10 fold or more.
- Index score: The probability that an application will give rise to 20-30% of algal taxa being significantly affected. This probability has been calibrated against actual field studies carried out with a variety of pesticides applied at known concentrations as well as modeled estimates of exposure. For such studies to show statistically ‘significant’ effects, reductions in the number of individuals in affected taxa often have to be more than 10 fold because of the natural high variation that exists in these systems.
Chronic Indices
Avian Chronic
- Undesirable effect: Prevention of birds breeding in and around fields because of persistent residues in food sources.
- Index score: The proportion of the typical breeding season (90 days) with residue levels such that reproduction is compromised in a sensitive 15g songbird. In other words, the highest risk score of 1.0 would be an application that potentially inhibits avian reproduction in at least 5% of species for the entire length of the “normal” breeding season. The determination of risk is based on laboratory studies of reproductive effects as well as accepted principles of exposure and toxicity extrapolation. There is no field information with which this probability can be verified.
Fish Chronic
- Undesirable effect: Fish in nearby receiving waters are prevented from breeding due to levels of pesticide residues exceeding the Maximum Acceptable Toxicant Concentration (MATC), the concentration at which breeding in the majority of fish species will be impeded.
- Index score: The proportion of the typical fish breeding season (30 days) where residue levels in receiving waters exceed the amount that impedes breeding in a sensitive fish species. The highest possible score of 1.0 would be a pesticide application that inhibits reproduction in at least 5% of fish species for the entire 30 day period. The determination of risk is based on laboratory studies of reproductive effects as well as modeled estimates of exposure and accepted relationships of acute to chronic effects measurements in a large body of fish studies. There is no field information with which this probability can be verified.
How can high environmental risks be mitigated?
High risk scores (>0.50) indicate a high probability that a pesticide application will have negative impact on an area of concern in the environment. Risks can be reduced in numerous ways, some of which can be measured in the Pesticide Risk Tool. The Pesticide Risk Tool can measure the reduction in risk caused by a reduction in the pesticide application rate and the reduction in risk caused by switching to a lower-risk pesticide product.
Other mitigation factors such as buffer zones or timing of the pesticide application are not taken into account by the tool’s risk calculation. Also, site specific factors such as the proximity to water bodies for aquatic indices will also affect the potential impacts of the pesticide application, but are not factored into the calculation. For example, if a pesticide is applied to an area that is not near a water body, the actual aquatic risk will be lower than indicated by the risk scores.
University extension experts and crop advisors can provide more extensive options for mitigation based on your location and crop.
Human Bystander Risk Indices
The following represent potential risks to workers and/or bystanders that are exposed to pesticides. Scores given are hazard quotients with scores greater than 1.0 representing a predicted exposure to a concentration greater than the determined threshold. This does not mean that harm is certain, rather it means that the estimated exposure could cause harm to vulnerable members of the population.
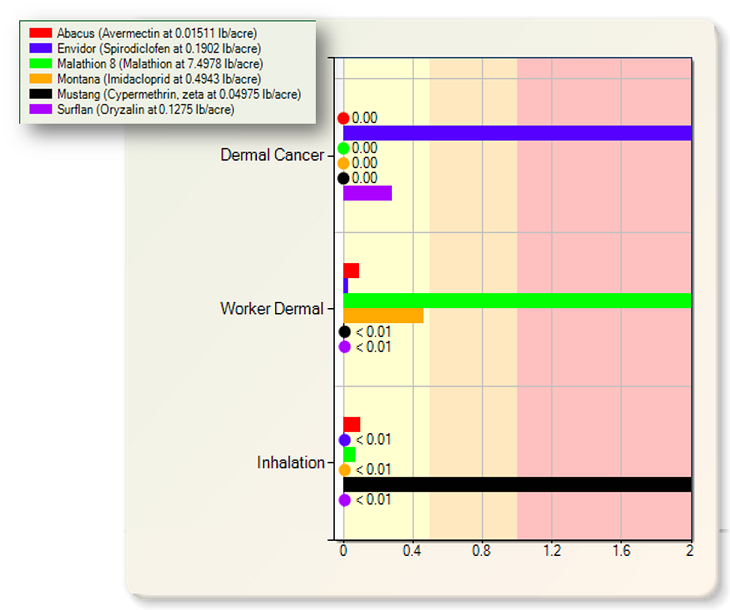
Image 3 (Human Bystander risk scores grouped by index)
Inhalation Risk
- Undesirable effect: Workers/bystanders are exposed to a pesticide at a concentration that would result in a dose that exceeds US EPA's short-term Population Adjusted Dose (PAD) for a one-year old child.
- Index score: The fraction of the reference dose to which a bystander is likely to be exposed via inhalation near the field after application. This index does not calculate the hazard for the pesticide applicator as the index assumes that the applicator is wearing the appropriate Personal Protective Equipment (PPE) including a face mask.
Worker Dermal
- Undesirable effect: Workers re-entering a treated field are exposed to a pesticide at a concentration that would result in a dose that exceeds the US EPA’s ‘reasonable certainty of no harm’ concentration for a pregnant woman.
- Index score: The fraction of the reference dose of which the worker is likely to be exposed to when they re-enter the field after an application. The index relies on the assumptions that workers re-enter the field at the end of the Restricted Entry Interval (REI), work for an eight-hour day and wear hats and gloves.
Worker Cancer
- Undesirable effect: A worker re-entering a treated field over several consecutive days receives a cumulative dose of carcinogenic pesticide through dermal absorption resulting in an increased risk of tumor development.
- Index score: The estimated cumulative dose absorbed by a worker re-entering exceeds the level of concern to produce an index score in excess of one cancer per million people. The index relies on the assumptions that workers first re-enter the field at the end of the Restricted Entry Interval (REI), work eight-hour days for five consecutive days each year and wear hats and gloves.
How can high human bystander risks be mitigated?
High risk scores indicate a high possibility that a pesticide application will have negative impact on humans working in and/or living nearby the treated fields. Risks can be reduced in numerous ways, some of which can be measured in the Pesticide Risk Tool. The Pesticide Risk Tool can measure the reduction in risk caused by a reduction in the pesticide application rate or by switching to a lower-risk pesticide product.
Other mitigation options are not taken into account by the tool's risk calculation. For example, for dermal indices, the tool assumes that workers re-enter the treated field immediately after the re-entry interval required on the pesticide label has passed. Increasing the interval between application and workers re-entering can reduce the hazard. The inhalation index is for humans near the field; ensuring that pesticides are not applied at times when groups could be exposed (e.g., at school break times or when workers are in adjacent field) can mitigate risk.
University extension experts and crop advisors can provide more extensive options for mitigation based on your location and crop.
Consumer Dietary Risk Indices
The following represent the relative chronic risk presented by pesticide residues on or in food.
Pesticide dietary risk from a single pesticide in one food is determined from the level of exposure in a given day and the pesticide’s toxicity. Pesticide exposure is determined by: (1) the estimated milligrams of pesticide per kilogram of food, and (2) how much food is consumed by the person. A person’s age, health status, body weight, and genetics also can markedly alter risk levels.
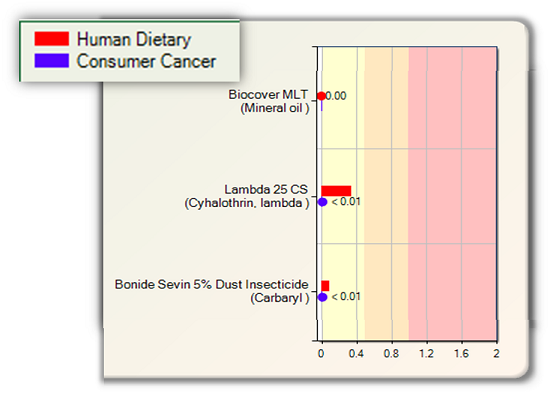
Image 4 (Consumer Dietary risk scores grouped by product)
Consumer Dietary Index
- Index Score: Consumer Dietary Risk Index (DRI) is the average of a specific pesticide residue level detected on or in food, divided by the maximum level of the pesticide that can be present in or on a food without exceeding the “reasonable certainly of no harm” as defined in the Food Quality Protection Act and implemented by the US EPA. When a person consumes food with residues in excess of this basic safety standard, the residues exceed the agency’s “level of concern”.
- The risk score gives an estimate of the degree to which a consumer’s exposure from a specific pesticide in a specific food meets or exceeds the “reasonable certainty of no harm” standard.
- The USDA’s Pesticide Data Program (PDP) annually samples 12-15 different foods pulled from supermarket shelves for pesticide residues. Residues used in the Pesticide Risk Tool to calculate mean residue levels are from the most recent year the food was tested.
- Scores at or below 0.1 are considered low risk and regarded as consistent with the US EPA’s “reasonable certainty of no harm.” A person ingesting a single food, or several foods, containing a specific pesticide that corresponds to a DRI score of 0.1 is ingesting just 10% of the daily dose EPA regards as posing very modest risk. DRI scores between 0.1 and 1.0 are considered moderate risk, while DRI scores greater than 1.0 are considered high risk likely in need of mitigation. Scores above 1.0 do not mean a high probability of harm, but rather represent a reduction in the typical margin of safety that the US EPA incorporates in assessing dietary risks and setting acceptable pesticide tolerance levels in food.
- A DRI score of 2.0, for example, means that a child consuming one serving of food would be consuming twice the amount of a pesticide residue that they could consume without exceeding the US EPA’s “level of concern.”
Consumer Cancer Index
- Index score: The Consumer Cancer Risk Index provides a highly health protective estimate of the lifetime cancer risk, often expressed as the excess number of cancers per million people. The estimated residue exceeds the level of concern when a person consumes food with sufficiently high residues of a carcinogenic pesticide to produce an index score in excess of one cancer per million people.
- The risk score provides a worst-case estimate of the degree to which a consumer’s lifetime exposure to a specific pesticide in a specific food results in the potential for development of cancer.
-
Inherent uncertainty is present in the consumer cancer risk scores. Much of the uncertainty is related to:
- Cancer risks are determined based on lifetime exposure to a pesticide. However, a single pesticide is unlikely to be registered with US EPA and continually used in agriculture over a 70-year period.
- Individuals are unlikely to consume the same foods in identical quantities from one day to the next. Therefore, pesticide exposure levels are variable, and likely change on a daily basis.
- The source of a given food/commodity may change over time, which suggests that the pesticides a person is exposed to each day is likely to be different.
- Consumption of the crop is assumed to happen immediately after harvest, however the time from harvest to consumption can vary greatly even with the same crop.
- Scores at or below 0.1 are considered low risk and regarded as consistent with the US EPA’s “reasonable certainty of no harm.” A person ingesting a single food, or several foods, containing a specific pesticide that corresponds to a Cancer Index score of 0.1 is ingesting a dose that may results in one incidence of cancer out of 10 million people based on worst-case assumptions. Index scores between 0.1 and 1.0 are considered moderate risk, while Index scores greater than 1.0 are considered high risk likely in need of mitigation. Scores above 1.0 do not necessarily indicate a high probability of cancer development in the general population. Rather, scores greater than 1.0 suggest that cancer incidence rates greater than 1.0 per million may result in populations consuming high levels of the pesticide over the course of several years and/or during sensitive life stages (0–16 years of age).
- A Cancer Index score of 2.0, for example, means that there is a reasonable likelihood that two incidences of cancer per million people may occur in a population of adults consuming one serving of food containing the pesticide residue each day over the course of a lifetime. Due to the assumption of lifetime exposure, consumer dietary cancer risk scores are considered upper estimates of the worst-case exposure scenarios.
How can high dietary risks be mitigated?
The purpose of the DRI is to highlight pesticide dietary risk reduction options for farmers, regulators, and consumers. The consumer risk indices bring attention to the potential hazard of certain pesticide residues to consumers. The Pesticide Risk Tool can measure the mitigation effect on changing the pesticide used or for the consumer cancer the application rate. The Pesticide Risk Tool does not take into account other mitigating factors that may reduce dietary risks. For example, the following use patterns may greatly alter expected, average residue levels in the harvested crop and are not reflected in tool's output:
- Pesticides applied before crops have begun to form, or applied to a non-fruiting part of the plant (e.g., pesticide applied to the trunk of an apple tree).
- Increasing the pre-harvest interval (PHI, the time between the application and harvest).
- Altering the timing of application, or type of formulation applied.
- For the DRI - Reducing the application rate of a pesticide.
University extension experts and crop advisors can provide more extensive options for mitigation based on your location, crop and pest issue.
Pollinator Index
This calculates the risk of pollinators such as wild or managed bees accumulating a lethal dose of a specific pesticide over a one-day period. Note that sub-lethal, chronic or reproductive effects are NOT considered, although these may be important also. The index consists of three separate sub-indices with their own separate scores:
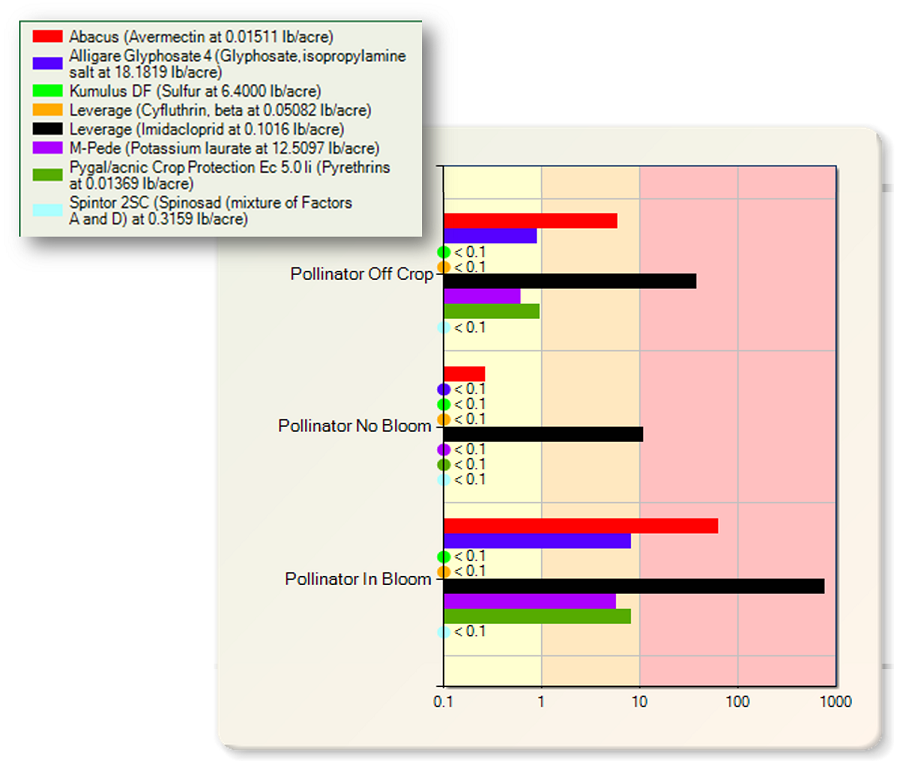
Image 5 (Pollinator risk scores grouped by index)
Off-crop score: The risk score to pollinators foraging outside of the crop area (e.g., field borders or neighboring fields) at the time of application. Pollinators are exposed entirely through pesticide drift – primarily through direct contact with the pesticide or on the pollen and nectar on which they forage.
Crop in bloom score: The risk score to pollinators foraging in the crop proper when this crop is in bloom. The risk score will be low or nil if the crop is deemed not to be attractive to pollinators. Please note that the presence of flowering weeds in a crop deemed unattractive to pollinators will lead to a serious underestimate of actual risk. Pollinators are exposed primarily through direct contact with the pesticide or on the pollen and nectar on which they forage. Please note that some pesticide labels prohibit applications when the crop is in bloom. Always follow the pesticide label. The tool's risk calculations assume pesticide label requirements are followed.
Crop not in bloom score: The risk-score to pollinators foraging in the crop proper when this crop is not in bloom even if the crop is deemed attractive to pollinators. Pollinators are exposed solely through the systemic activity of pesticides and eventual uptake in pollen and nectar. Please note that if there are flowering weeds in the field at time of spray, this score will greatly underestimate the true risk to pollinators.
- Undesirable effect: Pollinators accumulating a lethal dose of pesticides through a combination of all exposure routes appropriate to the specific sub-index.
- Index score: The estimated number of lethal doses accumulated daily by individual pollinators after a single visit to a treated field and following a day’s consumption of nectar and pollen from either a treated crop or flowers in the field margin.
How can high pollinator risk scores be mitigated?
The Pesticide Risk Tool can measure the reduction in risk caused by a reduction in the pesticide application rate and the reduction in risk caused by switching to a lower-risk pesticide product. The timing of an application can greatly reduce the risk, which will be evident either by moving the dates of pesticide applications or if the bloom dates are not known, comparing the risk scores for ‘crop in bloom’ and ‘crop not in bloom’.
Since the ‘off-crop’ risk is dependent on drift from treated fields, changes in application method or pesticide formulation are captured as mitigation efforts in the tool. Taking other measures to reduce drift will reduce the expected impact on pollinators. Drift-reduction measures are not yet captured in the tool.
Any high ‘crop not in bloom’ risk scores may also be mitigated by switching to a pesticide with lower systemic activity.
University extension experts and crop advisors can provide more extensive options for mitigation based on your location, crop and pest issue.
Reading the Risk Outputs - Greenhouse-Grown Crops
Not all indices apply to all growing conditions. Pesticide applications in greenhouses, for example, do not generate the same risks as applications in less controlled environments.
For most greenhouse operations, pesticide pathways to surface water, air and soil outside of the greenhouse will be limited due to reduced potential for drift and runoff. Risks to workers in adjacent areas, aquatic organisms, earthworms and other terrestrial invertebrates and birds will be reduced.
Potential exposures from disposal of contaminated growing media or plant material should be considered. Worker and consumer risk indices may also require special consideration for greenhouse environments due to difference in pesticide degradation.
The Pesticide Risk Tool will incorporate automatic consideration for greenhouse environments and fumigation in the future.
Missing Data
In some cases, the Pesticide Risk Tool will not have enough data required to make a risk calculation for a given index. A risk index could fail to calculate because we are missing the necessary physical and chemical properties (e.g. foliar half-life) for the active ingredient or because we are missing the necessary toxicity values for the end point of concern. If a risk bar is present, or a number is given (e.g. 0.00, or <0.01), then a calculation was made. In cases where no calculation is made, a risk score may be replaced by one of the following warnings or pass codes, indicating presumed low risk.
| The Risk Summary Legend
|
 0.00 0.00
|
Risk index score is 0.00
|
| <0.01
|
Risk index score is less than 0.01
|

|
Insufficient data for a risk calculation
|
 AB AB |
Repeated use of this antibiotic in the same field or block can select for antibiotic resistant bacteria. Contact regional disease control specialists in the event of slipping product performance, to determine if resistant phenotypes have emerged. |
| COR |
This pesticide is highly corrosive by the inhalation route (DANGER). Avoid inhalation of fumes. |
| COR1 |
Highly corrosive chlorine gas formed on contact with water (DANGER). Avoid inhalation of fumes. |
| COR3 |
This pesticide is highly corrosive to skin and eyes. |
| LE |
Low exposure assumed for this exposure route - no calculations were made |
| LEH |
Low exposure and low hazard assumed for this exposure route - no calculations were made |
| LEHDR |
Low exposure and hazard assumed - PDP did not test for this active ingredient in this crop |
| LH |
Low hazard for this exposure route - no calculations were made |
| LHDRI |
Low hazard assumed - PDP did not test for this active ingredient in this crop |
| N10 |
This pesticide is highly acutely toxic (DANGER). Although it may not be prone to evaporation and vapor drift, spray drift can pose a serious inhalation hazard. |
| N11 |
This pesticide is highly acutely toxic (WARNING). Spray drift can also pose an inhalation hazard. |
| N12 |
This pesticide is highly acutely toxic (WARNING). Although it may not be prone to evaporation and vapor drift, spray drift can pose an inhalation hazard. |
| NDA |
Human toxicity data not available for this pesticide. |
| NDRI |
PDP tested for this active ingredient and no residue was found. |
| NPDP |
PDP has not tested this crop for residue. |
| NIC |
Active ingredient not identified as carcinogenic by the Pesticide Research Institute in 2016 |
| QA |
No data; no assessment |
| S1DRI |
PDP did not test for this active ingredient in this crop |
| NPDP |
PDP has not tested this crop for residue. |
| W1 |
Rodenticides are extremely toxic to vertebrates. The key to safe use of rodenticides is exclude all but the target species from the bait through the use of efficient bait boxes. Dead rodents should also be disposed of in a way that will make it impossible for scavengers to find. |
| W2 |
Although standard toxicity data are lacking, this material is known to be a strong irritant and toxic by ingestion or inhalation |
| W3 |
The use of all copper products lead to an accumulation of copper in the soil which kills all earthworms. This can have negative consequences on disease management. |
| W4 |
Oils do not represent a toxicological risk but the consequences of fouling of bird feathers has not been assessed |
| W5 |
Forms glassy sharp coating on surfaces which may damage earthworms and other invertebrates |
| W6 |
No data are available. However, EPA has waived basic data requirements believing risk to be minimal |
| W7 |
This material is registered as an insecticide. Although bee toxicity data is not available, it should not be considered as necessarily safe to bees if used in a way that will expose bees and wild pollinators |
| W8 |
No data are available. However, fumigants are expected to be toxic to all soil-dwelling organisms including earthworms. |
| W9 |
This pesticide is an insect growth regulator that inhibits maturation and/or reproduction of insects. While these active ingredients may not be acutely toxic to bees, they can impair colony health (for honey bees or bumblebees) or reproduction (all bees). |
| Y |
Data missing and needed |
|
Low Risk Score Background Color |
|
Medium Risk Score Background Color |
|
High Risk Score Background Color |